Key Takeaways
- A cap rate is net operating income divided by property value. It measures one year of unlevered yield and excludes your mortgage entirely.
- Greater Phoenix multifamily compressed to a 5.8% average in Q2 2026, down 80 basis points from 6.6% a year earlier, while office sits above 9%.
- A higher cap rate is not a better deal. It prices weaker income durability, higher vacancy, or shorter lease terms.
- Cap rate tells you if the price is fair. Cash-on-cash return tells you if the deal works with your loan. You need both.
- Underwrite the exit cap rate 50 to 100 basis points above your going-in rate, or the deal depends on the market rather than on you.
A cap rate, short for capitalization rate, is a property’s annual net operating income divided by its price or market value, shown as a percentage. A Scottsdale building producing $420,000 of NOI at a $7,000,000 price carries a 6.0% cap rate. The number describes what the asset earns before financing, which is why two buyers with different loans still calculate the same cap rate on the same building.
What Is Capitalization Rate Commercial Real Estate Investors Actually Use?
The capitalization rate measures a commercial property’s first-year return because it strips financing out of the equation and leaves only what the asset itself earns. Two buyers looking at the same building with different loans will calculate different cash-on-cash returns, but they will calculate the same cap rate. That is precisely why the metric exists.
The cap rate formula:
Cap Rate = Net Operating Income (NOI) ÷ Current Market Value × 100
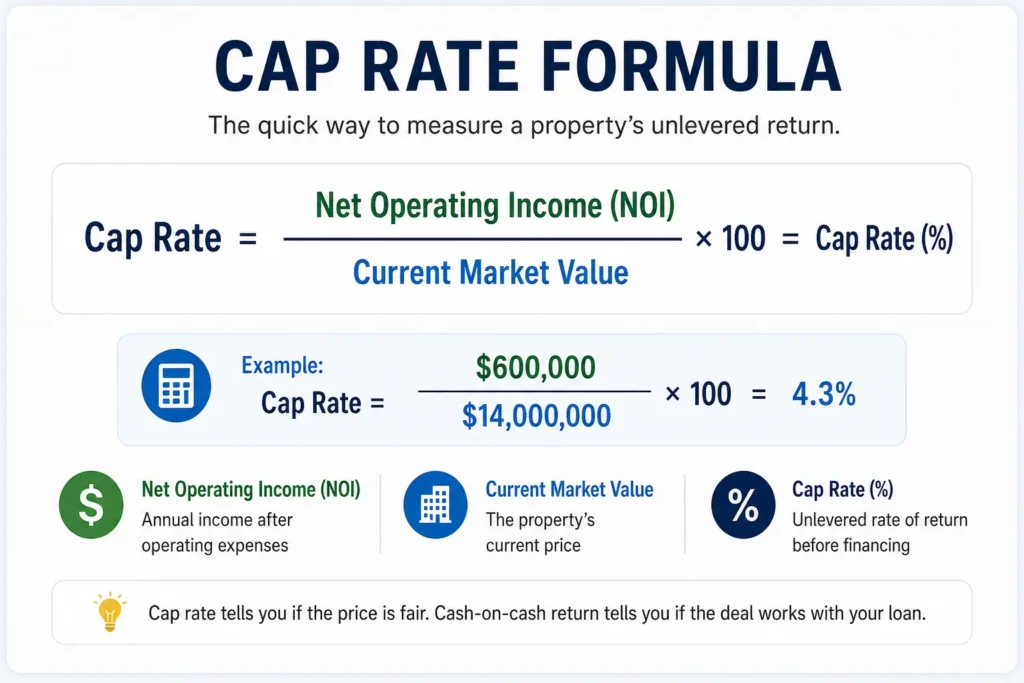
Three things fall outside the calculation, and every one of them trips up new investors:
- Debt service: Principal and interest are excluded. A cap rate says nothing about whether the deal cash flows after your loan payment.
- Capital expenditures: Roof replacement, HVAC systems, and parking lot resurfacing sit below the NOI line.
- Depreciation and income taxes: These are owner-specific, not property-specific.
Run the formula in reverse and it becomes a valuation tool, which is how brokers and appraisers across Arizona actually use it. If a Tempe industrial building produces $310,000 of NOI and comparable assets are trading at 5.9%, the indicated value is roughly $5,254,000. Origin Investments frames this well: the cap rate formula is mathematically almost identical to the formula for valuing a perpetuity, because property income streams theoretically run forever.
How to Calculate NOI Before You Calculate Cap Rate
Net operating income drives the entire calculation, so an error in NOI produces an error in value that is magnified by roughly sixteen times at a 6% cap. Build it in this order:
- Gross potential income: Every unit or suite at market rent, fully leased.
- Subtract vacancy and collection loss: In Phoenix multifamily, this matters. Metro vacancy sat near 11.8% in early 2026, well above the sub-5% retail figure.
- Add other income: Parking, storage, laundry, pet rent, signage, CAM reimbursements.
- Subtract operating expenses: Property taxes, insurance, management fees, utilities, landscaping, repairs, and reserves.
Arizona adds its own wrinkles here. Summer cooling loads push utility expense above what a Midwest comparable would show, water and landscape maintenance are real line items in the desert, and property tax treatment in Maricopa County can shift meaningfully after a sale triggers reassessment. A seller’s trailing-twelve NOI almost never reflects your post-closing tax bill.
Cap Rate Example: A Scottsdale Deal, Start to Finish
A worked example makes the mechanics concrete, so here is a realistic Scottsdale multi-tenant retail scenario.
- Gross potential rent: $640,000
- Vacancy and credit loss at 5%: minus $32,000
- CAM and other reimbursements: plus $88,000
- Effective gross income: $696,000
- Operating expenses (taxes, insurance, management, maintenance, reserves): minus $243,600
- Net operating income: $452,400
At an asking price of $7,850,000, the cap rate is $452,400 ÷ $7,850,000, or 5.76%.
Now the part competitors leave out. Suppose Maricopa County reassesses after closing and property taxes rise $22,000. NOI drops to $430,400 and your actual going-in cap rate falls to 5.48%. At a 5.76% market cap rate, that $22,000 of lost income has quietly erased about $382,000 of value. This is why experienced Arizona buyers underwrite a reassessed tax figure rather than accepting the seller’s pro forma.
What Is a Good Cap Rate in Phoenix and Scottsdale?
A good cap rate depends on asset class, location quality, and your own return requirements, but Greater Phoenix currently trades in a range that most national articles never quote. PNC notes that commercial investors generally target somewhere in the 4% to 10% band. Arizona sits inside that range with wide dispersion by sector.
Here is where the Valley stood through the first half of 2026:
| Property Type | Greater Phoenix Cap Rate Range | Market Note |
|---|---|---|
| Multifamily Class A | 4.7% to 5.0% | Class A averaged 4.74% in Q1 2026 |
| Multifamily Class B | 4.9% to 5.4% | Class B 4.92%, Class C 5.38% |
| Multifamily overall | 5.8% average | Compressed 80 bps from 6.6% a year earlier per Kidder Mathews |
| Industrial Class A | 4.8% to 5.5% | Class C stretches to 6.71% |
| Retail, single-tenant NNN | 5.0% to 6.0% | Retail vacancy near 4.5%, the tightest sector |
| Retail, neighborhood centers | High 5% to 6% | Malls and power centers price 7.0% and wider |
| Office | 9.0% and above | Class A office vacancy near 29.1% |
Two conclusions follow. First, the Phoenix multifamily cap rate compressed roughly 80 basis points year over year while average price per unit rose 3.6% to $266,672, which is the market telling you investor confidence returned faster than rents did. Second, the spread between a 4.7% Class A apartment and a 9%-plus office building is not free money. It is the market pricing 29% office vacancy and genuine leasing risk.
For comparison, JPMorgan’s Q4 2025 national figures put multifamily at 6.1%, industrial at 7.2%, retail at 7.3%, and office at 9.1%. Phoenix multifamily and industrial both trade meaningfully tighter than the national average, which reflects the Valley’s population and job growth story rather than a mispricing.
Is a Higher Cap Rate Better?
A higher cap rate is not automatically better, because cap rates price risk. A high cap rate signals that the market expects flat or declining income, higher vacancy, weaker tenant credit, deferred maintenance, or a less durable location. A low cap rate signals expected income growth and stability. Higher yield today usually means you are being paid to accept a harder tomorrow.
The clearest way to see this is the relationship Origin Investments describes: a cap rate is roughly the investor’s expected return minus the expected growth rate of income. A property at an 11% cap with income declining 3% per year and a property at a 5% cap with income growing 3% per year can deliver the same 8% return. The first investor gets it all through cash flow and loses principal value. The second gets it through cash flow plus appreciation.
That distinction matters enormously in a market like Scottsdale, where rent growth expectations and barriers to entry have historically compressed cap rates below national comparables.
Cap Rate vs Cash-on-Cash Return: The Comparison Nobody Publishes
Cap rate and cash-on-cash return answer different questions, and confusing the two is the single most common analytical mistake I see among Arizona buyers moving from residential into commercial. Cap rate measures the property. Cash-on-cash measures your position in the property.
| Metric | What It Measures | Includes Debt? | Best Used For |
|---|---|---|---|
| Cap rate | Unlevered first-year yield on total value | No | Comparing properties against each other and against the market |
| Cash-on-cash return | Annual pre-tax cash flow ÷ cash invested | Yes | Judging whether the deal works for your capital stack |
| ROI | Total return over the hold, including appreciation | Yes | Measuring realized performance after the fact |
| IRR | Time-weighted return across the full hold period | Yes | Comparing deals with different hold lengths and cash flow timing |
Run the Scottsdale retail example through both. NOI is $452,400 on a $7,850,000 purchase, so the cap rate is 5.76%. Now assume 35% down ($2,747,500) and a $5,102,500 loan at 6.4% amortizing over 25 years. Annual debt service runs roughly $409,000. Cash flow after debt service is about $43,400, which is a cash-on-cash return near 1.6%.
That is the arithmetic behind negative or thin leverage. When your borrowing cost exceeds the cap rate, debt reduces your return rather than amplifying it. A 5.76% cap financed at 6.4% is not a broken deal, but it is a deal that only works if you have a credible plan to grow NOI, whether through rent roll-ups, expense control, or a lease-up.
The practical rule: use the cap rate to decide whether the price is fair, and cash-on-cash to decide whether you can live with the deal.
Going-In, Pro Forma, and Terminal Cap Rates
Three different cap rates appear in a single offering memorandum, and they are not interchangeable. Knowing which one a broker is quoting protects you from paying for income that does not exist yet.
- Going-in cap rate: Based on actual, in-place, trailing-twelve NOI at your purchase price. This is the honest number.
- Pro forma cap rate: Based on projected NOI after lease-up, renovation, or rent increases. Always higher. Always a forecast, not a fact.
- Terminal or exit cap rate: The cap rate you assume a future buyer will pay when you sell. This drives your exit price and therefore most of your IRR.
Underwriting discipline lives in that third number. Origin Investments treats it as best practice to drift the terminal cap rate above today’s market, using 5.5% to 6.0% when current stabilized rates are 5.0%. If someone hands you a Phoenix underwriting model that exits at a cap rate at or below the going-in rate, that model is assuming the market improves for you. Assume the opposite and see whether the deal still clears.
Applied to the Valley today: with multifamily already compressed to 5.8% from 6.6%, underwriting an exit at 5.5% is an aggressive bet on continued compression. Underwriting an exit at 6.25% is prudence.
What Moves Cap Rates in the Arizona Market
Cap rates move when the market’s required return or its growth expectations change, and both are shaped by forces above the individual property. The drivers that matter most in Greater Phoenix:
- Interest rates: Rising rates lift the cost of capital and push cap rates up, because buyers will not pay the same price for the same income when borrowing gets more expensive. JPMorgan notes rate changes are not the primary driver, but they are a persistent influence.
- Supply and absorption: Phoenix industrial deliveries fell sharply while absorption grew, flipping a three-year supply overhang. Multifamily absorption hit record levels in Q1 2026 and outpaced deliveries for the first time since early 2021. Tightening supply supports lower cap rates.
- Asset class fundamentals: Retail vacancy near 4.5% with rent growth close to 6.97% year over year explains why well-located Valley retail prices in the high 5s while office sits above 9%.
- Location quality: Proximity to employment cores, freeway access, and school districts matters. Properties in Paradise Valley and the Arcadia corridor consistently trade tighter than comparable product on the metro fringe.
- Tenant credit and lease duration: A fifteen-year corporate NNN lease behaves like a bond and prices like one. Month-to-month tenancy does not.
- Population and job growth: Greater Phoenix continues to attract both residents and capital, and the reasons Scottsdale keeps drawing high-net-worth relocations are the same reasons investors accept lower yields here.
When the Cap Rate Is the Wrong Tool
Cap rates break down whenever income is unstable, because the entire method assumes a durable, repeating income stream. Skip the metric or heavily discount it in these situations:
- Ground-up development: There is no NOI until stabilization. Use yield on cost instead.
- Heavy value-add and repositioning: A building at 50% occupancy has no meaningful cap rate. Underwrite the stabilized pro forma and the cost to get there.
- Short-term and vacation rentals: Seasonal swings across Scottsdale’s rental market make trailing income a poor predictor.
- Owner-user purchases: If you are buying a building for your own business, occupancy cost and equity build matter more than yield.
- Single-tenant properties with near-term rollover: A 15% cap on a building whose only tenant leaves in fourteen months is a vacancy in disguise.
In practice, I tell clients that a cap rate is a screening tool, not a decision tool. It narrows a list of twenty properties to four. The other four metrics decide which one you buy.
Practical Steps: Using Cap Rates on an Arizona Deal
- Pull the trailing twelve, not the pro forma. Ask for T-12 operating statements, the current rent roll, and every lease. Reconcile them against each other.
- Rebuild NOI yourself. Add reserves the seller omitted. Adjust property tax to a post-sale reassessment estimate. Use realistic Valley vacancy for the asset class.
- Calculate the going-in cap rate on your NOI. Compare it to the price the seller wants, not the price they hope for.
- Benchmark against genuine comparables. Same submarket, same asset class, same vintage, same tenant profile. A Chandler industrial comp does not price a north Scottsdale medical office building.
- Layer in your financing and run cash-on-cash. If the cap rate sits below your borrowing rate, identify exactly how you will grow NOI.
- Stress the exit. Model a terminal cap rate 50 to 100 basis points above your going-in rate. If returns collapse, the deal depends on the market rather than on you.
- Confirm value independently. An appraisal or broker opinion of value grounds your number. The same discipline that governs who pays for an appraisal in a residential deal applies here, with higher stakes.
Frequently Asked Questions About Cap Rates
What is a good cap rate in Arizona right now?
For Greater Phoenix in 2026, Class A multifamily trades near 4.7% to 5.0%, Class B and C between 4.9% and 5.4%, well-located retail in the high 5% to 6% range, industrial from 4.8% to 6.7% by class, and office above 9%. A good cap rate is one that fairly compensates you for that specific asset’s risk.
Does the cap rate include the mortgage?
No. The cap rate excludes debt service entirely. It measures the property’s unlevered yield, which is what allows two investors with different loans to compare the same asset on identical terms. To account for financing, calculate cash-on-cash return instead, which divides annual pre-tax cash flow after debt service by the cash you actually invested.
What does a 6 cap mean?
A 6 cap means the property produces net operating income equal to 6% of its value each year, before any loan payment. A building priced at $4,000,000 at a 6 cap generates $240,000 of annual NOI. It also implies roughly sixteen to seventeen years to recover the purchase price from operations alone, ignoring appreciation.
How do interest rates affect cap rates in Phoenix?
Rising interest rates raise borrowing costs, which reduces what buyers can pay for a given income stream and pushes cap rates upward. Falling rates typically compress cap rates and lift values. The relationship is directional rather than mechanical, since Phoenix rent growth and absorption can offset rate pressure, as multifamily compression through 2026 demonstrated.
What is the difference between cap rate and ROI?
Cap rate measures a single year of unlevered property yield and ignores financing. ROI measures total return on the capital you invested across the entire hold, including leverage, appreciation, and eventual sale proceeds. Cap rate screens and prices deals. ROI tells you how the investment actually performed.
The Bottom Line for Arizona Investors
Understanding what is capitalization rate commercial real estate pricing really reflects changes how you read every offering memorandum you receive. The formula takes ten seconds. The judgment behind it, knowing whether a 5.8% Phoenix multifamily cap is a fair price for durable income or a bet on continued compression, is what protects your capital.
Greater Phoenix in 2026 is a market where the fundamentals moved before the pricing did. Multifamily absorption hit records, industrial supply corrected, and retail stayed the tightest sector in the Valley. Cap rates responded, and buyers who understood why were positioned before the compression, not after it.
If you are evaluating commercial or investment property across Scottsdale, Phoenix, Paradise Valley, or Arcadia, or you are on the other side of the table and want to know how to find the right buyer for a commercial property, I am glad to walk through the numbers with you. Reach out to Kelly Jones for a straight read on what your property is worth and what the market will actually pay for it.